Heat Resilience Solutions for Boston
This plan provides a citywide framework to prepare Boston for hotter summers, with particular focus on Boston's environmental justice neighborhoods. Together, we can build a more just, equitable, and resilient Boston.
key takeaways from the report
Through leadership and collaboration, we can help prepare our communities, buildings, infrastructure, and natural spaces for the impacts of climate change, including extreme heat, while putting Boston on a path to becoming a Green New Deal city.
1. Boston is already experiencing the effects of climate change.
In Massachusetts, we have already seen average temperatures increase by almost 3.5°F. Over the last decade, Boston experienced more hot days and nights than any decade in the previous 50 years.
2. We will experience increasingly hotter summers and greater heat stress.
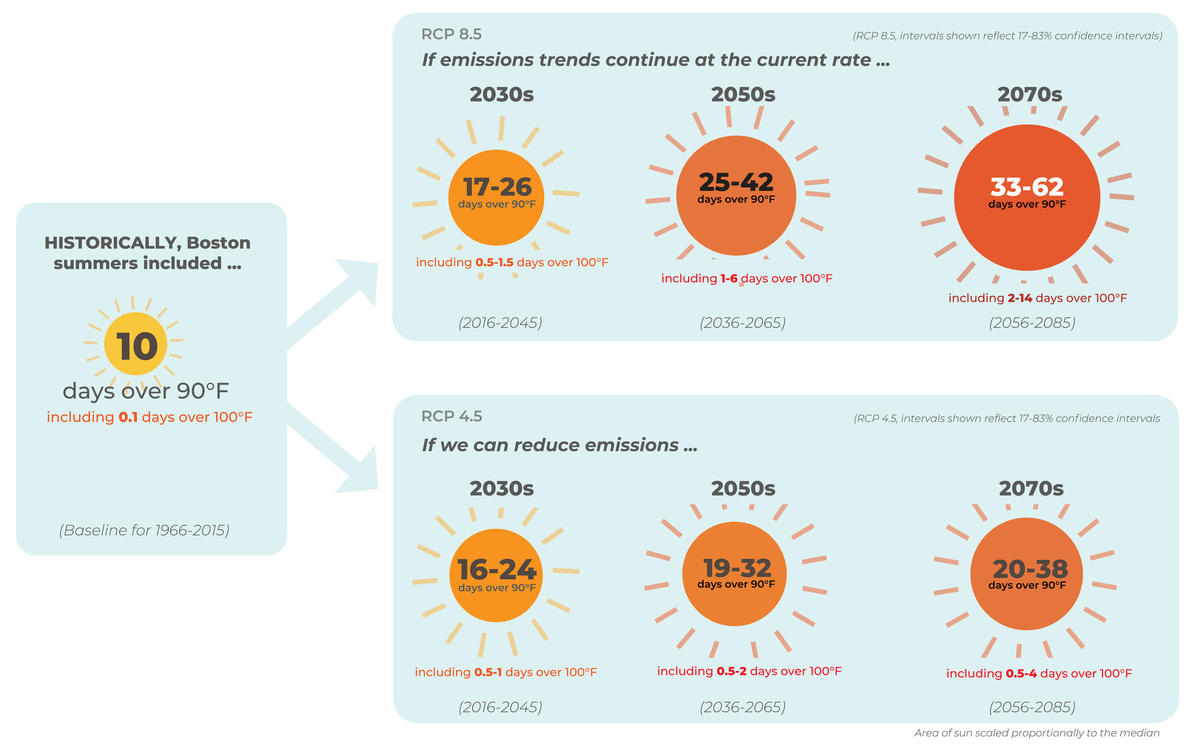
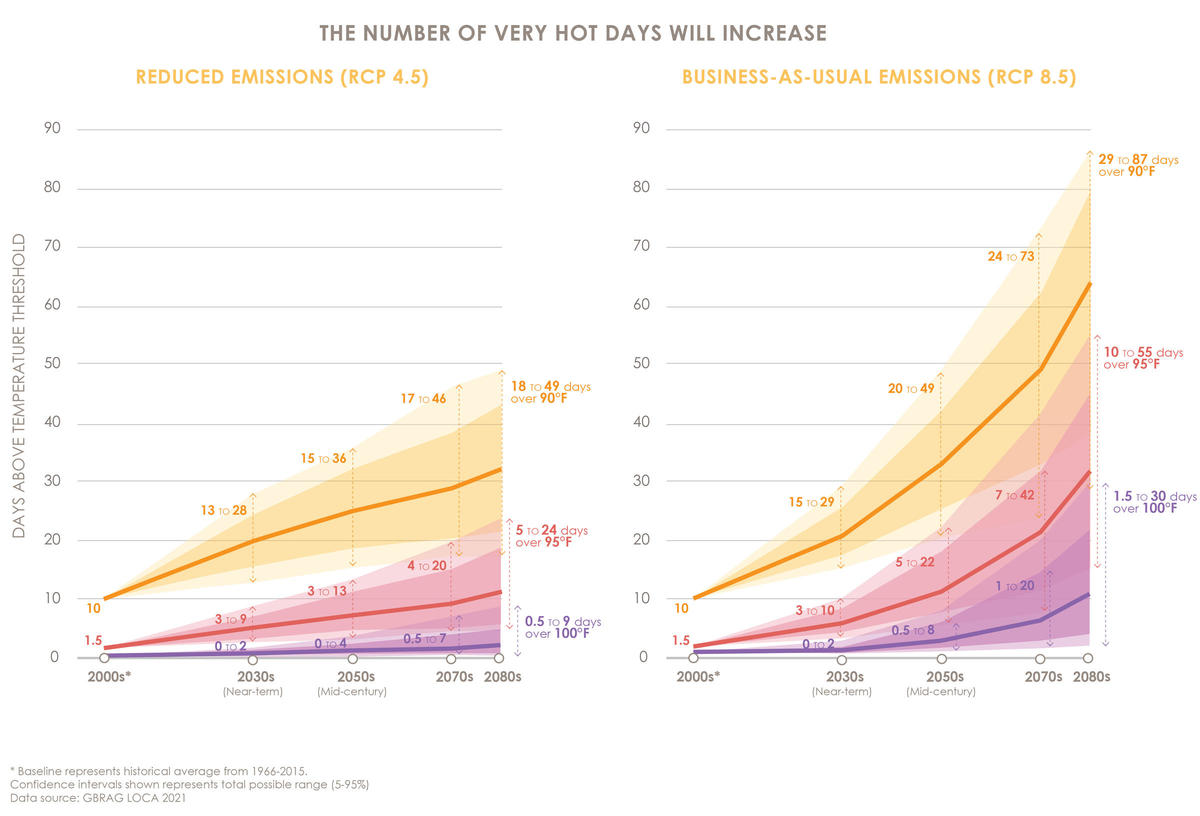
Even if major action is taken to reduce emissions, the number of days in Boston over 90°F will increase from a historical average of 10 days per year to as many as 46 days per year by the 2070’s.
3. Preparing for hotter summers is critical to public health and safety.
In the United States, extreme heat is already the #1 cause of weather-related deaths, more than tornadoes, hurricanes, flooding, and cold weather combined.
4. We must continue to prepare for both the near-term and long-term.
The Heat Plan provides a citywide framework to build a more just, equitable, and resilient Boston, both today and in the coming decades.
5. The entire city of Boston is a heat island.
Cities like Boston have densely developed buildings, asphalt, pavement, dark roofs, and other heat sinks that store and release heat on a hot day, resulting in average temperatures that are higher than surrounding communities.
6. Not everyone experiences a hot day in Boston in the same way.
Some areas of Boston are hotter than the rest of the city, entering high-heat conditions sooner, reaching higher air temperatures, and remaining in heat wave conditions longer.
7. Equitable heat resilience means putting people at the center.
We can deliver more just and equitable outcomes for residents by also increasing access to cooling resources and addressing underlying factors that result in greater burdens upon some residents.
8. How we build climate resilience matters.
By centering people and personal experiences alongside policies focused on infrastructure and buildings, we can deliver a wider range of strategies that can better address individual and systemic injustice and inequity.
9. Preparing for hotter summers provides multiple benefits.
Investments in heat resilience can provide multiple benefits, including lower greenhouse gas emissions, less air pollution, healthier residents, safer commutes and workplaces, and greater quality of life.
10. Together, we can build a more just, equitable, and resilient Boston.
By implementing the strategies in Boston’s Heat Plan, we can help put Boston on a path to becoming a Green New Deal city and ensure that everyone can thrive in the face of climate change.
What does heat resilience mean in Boston?
Resource Access
Ensuring that all residents have the resources needed to stay safe and cool during hot summers.
Intentional investment
Reducing temperatures in hotspots areas throughout the city through targeted investments.
Indoor & outdoor approach
Transforming indoor and outdoor spaces to help preserve the health and wellbeing of residents.
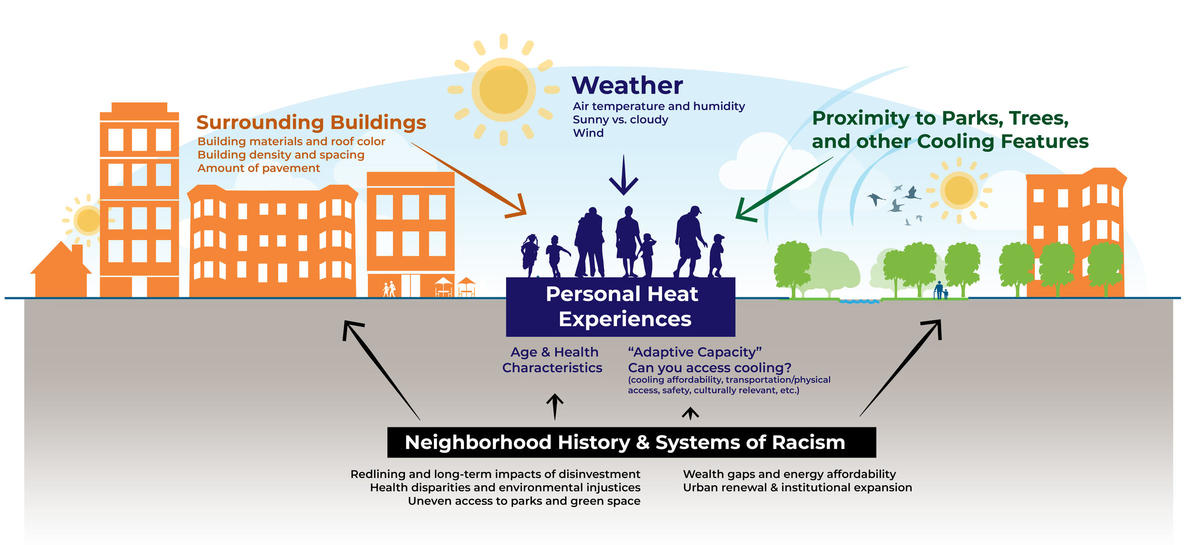
BOSTON'S STRATEGIES ADDRESS ALL FACTORS OF HEAT RISK:
Greater heat exposure can also be a result of the surrounding built environment. While all of Boston experiences extreme heat, there are localized temperature hot spots across the city where the risks of extreme heat are greater. For example, areas adjacent to dark, paved surfaces without canopy cover experience higher temperatures as a result of direct sunlight that is absorbed by the surface.
People with elevated heat exposure include those with jobs, living situations, or hobbies in outdoor or indoor environments without adequate shade to block direct sunlight or ventilation to circulate cool air flow. Examples of people with elevated heat exposure include people experiencing homelessness, residents in temperature hotspots, outdoor workers, and athletes.
People with chronic health conditions can be more vulnerable to heat as they may be less likely to sense changes in temperature or may be taking medications that can make the effects of heat worse.
Children and youth often rely on others to keep them cool and hydrated when it is hot outside, and may not understand the signs of heat-related illness before they become more severe.
Older adults do not adjust as well as younger people to sudden temperature changes and are more likely to have chronic medical conditions that change their body response to heat.
Low adaptive capacity can result from barriers to opportunities and resources that help cope with heat stress. People with lower adaptive capacity may be unable to make their immediate surroundings cooler or more comfortable, to relocate to a cooler place, or to receive help from others nearby.
- Individuals who live alone or do not have close social contacts to reach out to for support
- Homebound individuals or people with limited mobility
- People without A/C or limited use due to utilities affordability
- People lacking access to transportation
- Individuals facing language barriers
INTRODUCTION TO HEAT VULNERABILITY
Heat vulnerability describes how likely someone is to experience heat-related health problems. The risks of extreme heat can disproportionately affect some people and communities more than others.
HEAT IMPACTS ON REDLINED NEIGHBORHOODS
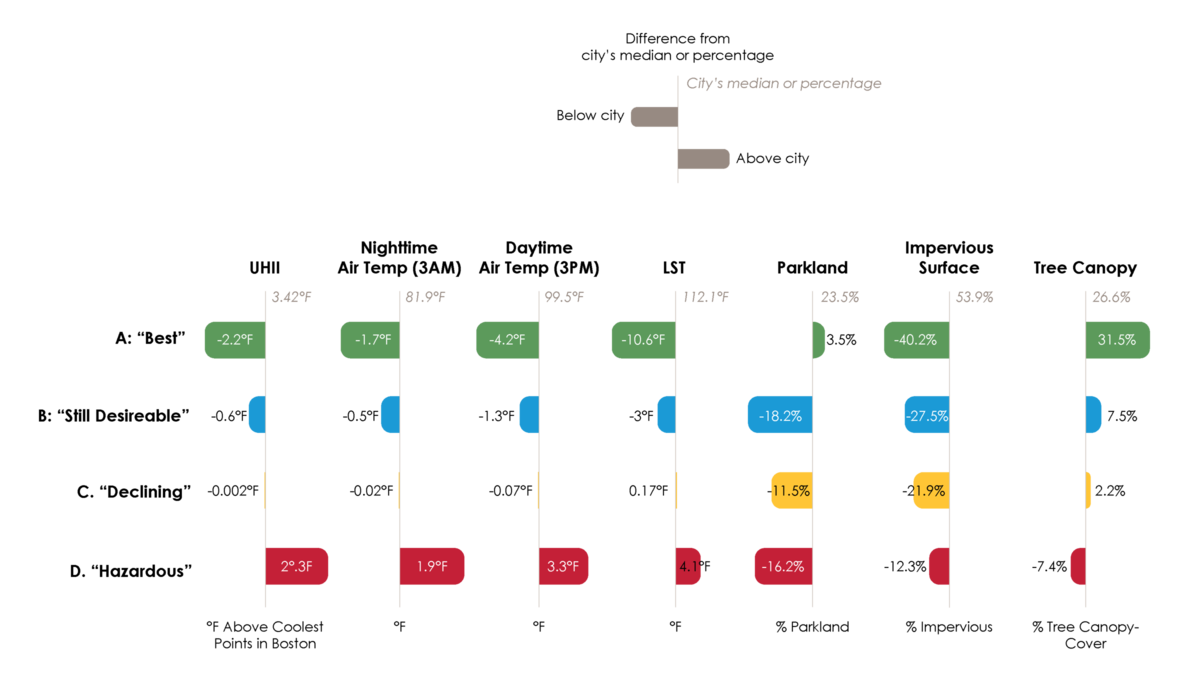
As we continue to prepare for climate change, we must consider Boston's historical context. Today, formerly redlined areas of Boston experience greater burdens during hotter summers. During a heat wave, redlined areas can be 7.5°F hotter in the day and 3.6°F hotter at night than the rest of Boston. They have 20% less parkland and 40% less tree canopy than areas designated as “A: Best.”
HEAT RESILIENCE and REDLINED AREAS OF BOSTON
Historic and future heat trends
HISTORIC HEAT TRENDS
In Massachusetts, due to climate change, temperatures have increased by 3.5°F since the beginning of the 20th century. In the last decade (2010–2020), Boston experienced more hot days than any decade in the previous 50 years. Historically, Boston summers included around 10 days over 90°F.
FUTURE HEAT TRENDS
How much Boston’s temperatures continue to increase will depend on how quickly and by how much global greenhouse gas emissions can be reduced. Even a small increase in average temperatures will lead to more frequent very hot days and nights, along with longer and hotter heat waves.
DAYS OVER 80°F IN BOSTON
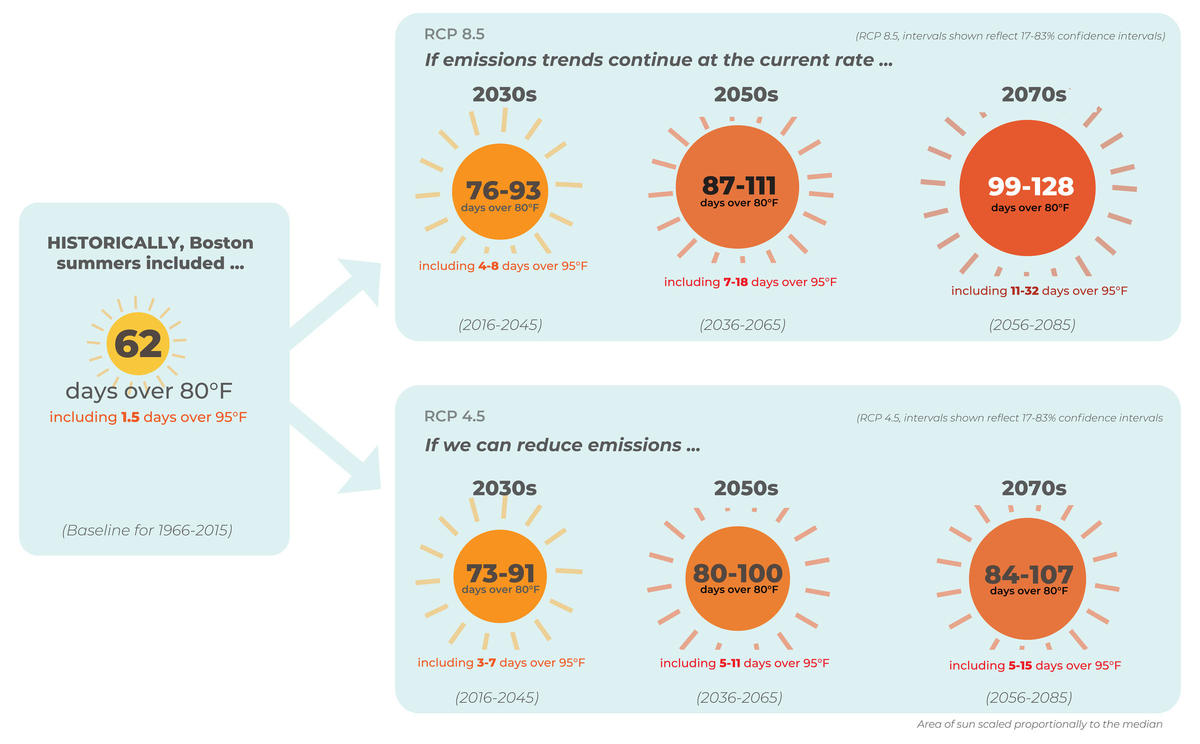
Boston will face an increase in chronic heat risk with more days over 80 degrees through the summer. If greenhouse gas emissions continue at the current rate, it is likely that Boston will have up to around 130 days over 80°F each year by the 2070’s.
DAYS OVER 90°F IN BOSTON
If greenhouse gas emissions continue at the current rate, it's likely that Boston will have up to around 60 days over 90°F each year by the 2070’s. If aggressive action is taken to reduce greenhouse gas emissions, it's likely that Boston will have up to approximately 40 days over 90°F each year by the 2070’s.
BY REDUCING EMISSIONS, WE CAN STAY COOLER
Boston's local climate future depends upon reducing global emissions. The number of hot days will increase in Boston, as a result of greenhouse gas emissions that have already happened. That's why Boston is preparing for hotter summers now.
CITYWIDE HEAT ANALYSIS
Data from a very intense heat wave from July 2019 with peak temperatures of approximately 96.8°F was used to produce modeled air temperature maps for the plan. These maps below include daytime temperature, nighttime temperature, heat event duration, and urban heat island index.
-
View the new extreme heat data on the Boston Heat Map Explorer.
-
View the technical memo for the Citywide Heat Analysis methodology.
DAYTIME Temperature
The daytime air temperature maps represented here show temperatures across Boston at 3pm during the modeled heat wave. Daytime temperatures are higher in areas that have high solar exposure, limited vegetation, or limited ventilation.
NIGHTTIME Temperature
The nighttime air temperature map shows temperatures across Boston at 3am during the modeled heat wave. Nighttime temperatures are higher in densely built urban centers that have limited ventilation, restricted sky view, and high thermal storage.
URBAN HEAT ISLAND INDEX
The Urban Heat Island Index (UHII) map shows the difference in temperatures across Boston during the modeled heat wave in comparison to the coolest points in Boston. The UHII is higher in areas with wide roads, limited vegetation, and dense development.
HEAT DURATION
The heat duration maps show the number of hours exceeding 95°F during the day or 75°F at night for areas across Boston during the modeled heat wave. Areas like Chinatown remain in high-heat conditions for 37 hours, with afternoon air temperatures climbing to 104 to 107°F and nighttime temperatures in much of the neighborhood over 90°F.
BOSTON HEAT EXPERIENCES
Boston residents and stakeholders informed the development of heat resilience strategies through online surveys, focus neighborhood idea sessions, a youth idea session, and open houses.
HEAT RESILIENCE STORies
The Heat Resilience Story Comic Builder is a web-based community engagement tool developed for the plan to cultivate empathy through storytelling. Using the Comic Builder, participants can build a personal avatar and design three scenes that reflect their heat experience. Heat stories were compiled into a virtual flip book for participants to read each other’s stories and see the variety of heat experiences.
Build your comic
Check out Boston Heat Stories
CITYWIDE HEAT RESILIENCE STRATEGIES
The 26 strategies presented below represent the City of Boston's plans to increase heat resilience and address the impacts of climate change. They are organized into eight layers of actions that will provide relief during heat waves and build cooler communities. These strategies will help ensure that all Bostonians, especially those most disadvantaged and overburdened, can thrive in the face of climate change.
Download Chapter 6 of the Heat Plan for more information on each strategy.
GOALS

REDUCE HEAT EXPOSURE
Reduce indoor and outdoor urban heat exposure, intensity, and duration by enhancing the capacity of the built environment to recover from daytime heat.

ADAPT TO HEAT
Expand choices for staying cool during heat waves and improve awareness of actions residents can take to stay safe and cool.

REDUCE SENSITIVITY AND FOSTER HEALTHY, CONNECTED COMMUNITIES
Create healthier, more connected neighborhoods that help reduce underlying social determinants of health that increase heat risk.
KEY PRINCIPLES

PRIORITIZE MULTIPLE BENEFITS
Leverage heat resilience strategies to advance economic opportunity, reduce carbon emissions, increase green spaces, and improve health for Bostonians and our environment.

AN ENVIRONMENTAL JUSTICE AND EQUITY LENS
By centering environmental justice and equity, Boston can better address root causes of increased risk and vulnerability in communities who are disproportionately affected by climate change - and ensure that the City of Boston equitably protects all residents and effectively addresses the needs of the most overburdened residents.

DATA-DRIVEN PLANNING
Continue to refine temperature models and utilize them alongside robust community engagement to help inform decisions.
1 Operations and communications
Form an inter-departmental group that meets regularly to coordinate integrated responses to weather related climate hazards including extreme temperatures.
Pre-position resources to support residents and other stakeholders before heat waves.
Deploy targeted networks of heat sensors to inform on-going planning and measure progress.
2 Cooling off during heat waves
Create an expanded network of free-to-access cooling locations
Focus dedicated programming and clear messaging in public cooling centers and identify opportunities to expand services.
3 Looking out for neighbors
Support leadership development and community-identified heat resilience priorities.
Provide information and guidelines about summer safety for outdoor workers.
4 Awareness, education, and training
Launch a multi-pronged public education campaign to increase awareness of heat risks and cooling options.
Deploy a citywide survey to measure public perceptions about heat risks and barriers to accessing cooling and improve access to resources and services.
Provide career pathways in green jobs including energy retrofits, cool roof installations, and tree planting and maintenance.
5 Buildings
Distribute resources to support cooler homes.
Invest in cool roofs to reduce heat: white roofs that reflect solar radiation, green planted roofs that insulate and absorb rainwater, and solar roofs that generate renewable energy and shade.
Improve energy efficiency, indoor thermal comfort, and reduce energy cost burdens by facilitating home energy retrofits.
In public and affordable housing communities, invest in energy retrofits and climate resilient design.
Improve energy efficiency, indoor and outdoor thermal comfort, and outdoor shading in schoolyards, and promote education about heat resilience.
6 Parks, trees, and outdoor spaces
Integrate opportunities to add new green space into street improvement projects.
Lead by example by ensuring municipal sites are supporting and contributing to cooler neighborhoods.
Increase public access to water with additional drinking fountains and water bottle fillers in areas with high heat exposure.
Enhance and enlarge Boston’s network of resilient community parks.
7 Transportation and infrastructure
Create cooler commutes through shaded bus stops, cool pathways, and other mobility improvements.
Energy grid upgrades, district energy microgrids, or other strategies to reduce risk of power outages during heat waves.
In streets and public spaces, reduce localized extreme heat and increase access to cooling resources while supporting local businesses.
8 Planning, zoning, and permitting
Ensure new development documents heat resilience impacts and benefits.
Create guidelines to incorporate heat resilience strategies into future buildings, building retrofits, and their sites.
Ensure new development supports neighborhood heat resilience.
Heat Resilience Resource Guides
Raising awareness of existing resources is a critical part of increasing access to cooling. Communities shared throughout the planning process that consolidated information about how residents can apply heat resilient strategies in their own home and communities will help facilitate strong and healthy communities.
Resource Guides are one-page summaries of existing local resources to stay cool in the heat every summer. Resource Guides provide information about how to stay cool and where you can find additional information for a wide-range of audiences on these three topics:
- Utilities Assistance Programs: A summary of what utilities assistance programs are available.
- Stay Cool At Home: Five simple ways for people to stay cool at home.
- Find Cooling in Your Neighborhood: A summary of where residents can find more information about where they can go to cool down, and transportation options for older adults and persons with disabilities.


