
Boston's Labor Market
Interested in Boston's Workforce? We have information on the Labor Market, Economy, and Population.
This page contains resources developed by the City of Boston, the Commonwealth of Massachusetts, and other local and regional organizations for analyzing Boston's workforce and labor market. These resources include interactive dashboards, reports, and data sources. Scroll down to get started, or navigate to a specific section using the links above.
-
Still have questions? Contact:
Workforce Development
-
 43 Hawkins Street
Boston, MA 02114
Boston's Population
This dashboard is built on data provided by the City of Boston Planning Department Research Division, which can be accessed through the department's MyDemographic Viewer tool.
Boston's Labor Force
These dashboards are produced by the Massachusetts Department of Economic Research. Find more data visualizations by DER here.
The first visualization below is built on data from the Bureau of Labor Statistics' Local Area Unemployment Statistics program. By default, it shows the most recent data available on Boston's labor force and unemployment. To view information on other dates or regions, use the drop-downs on the top of the dashboard."

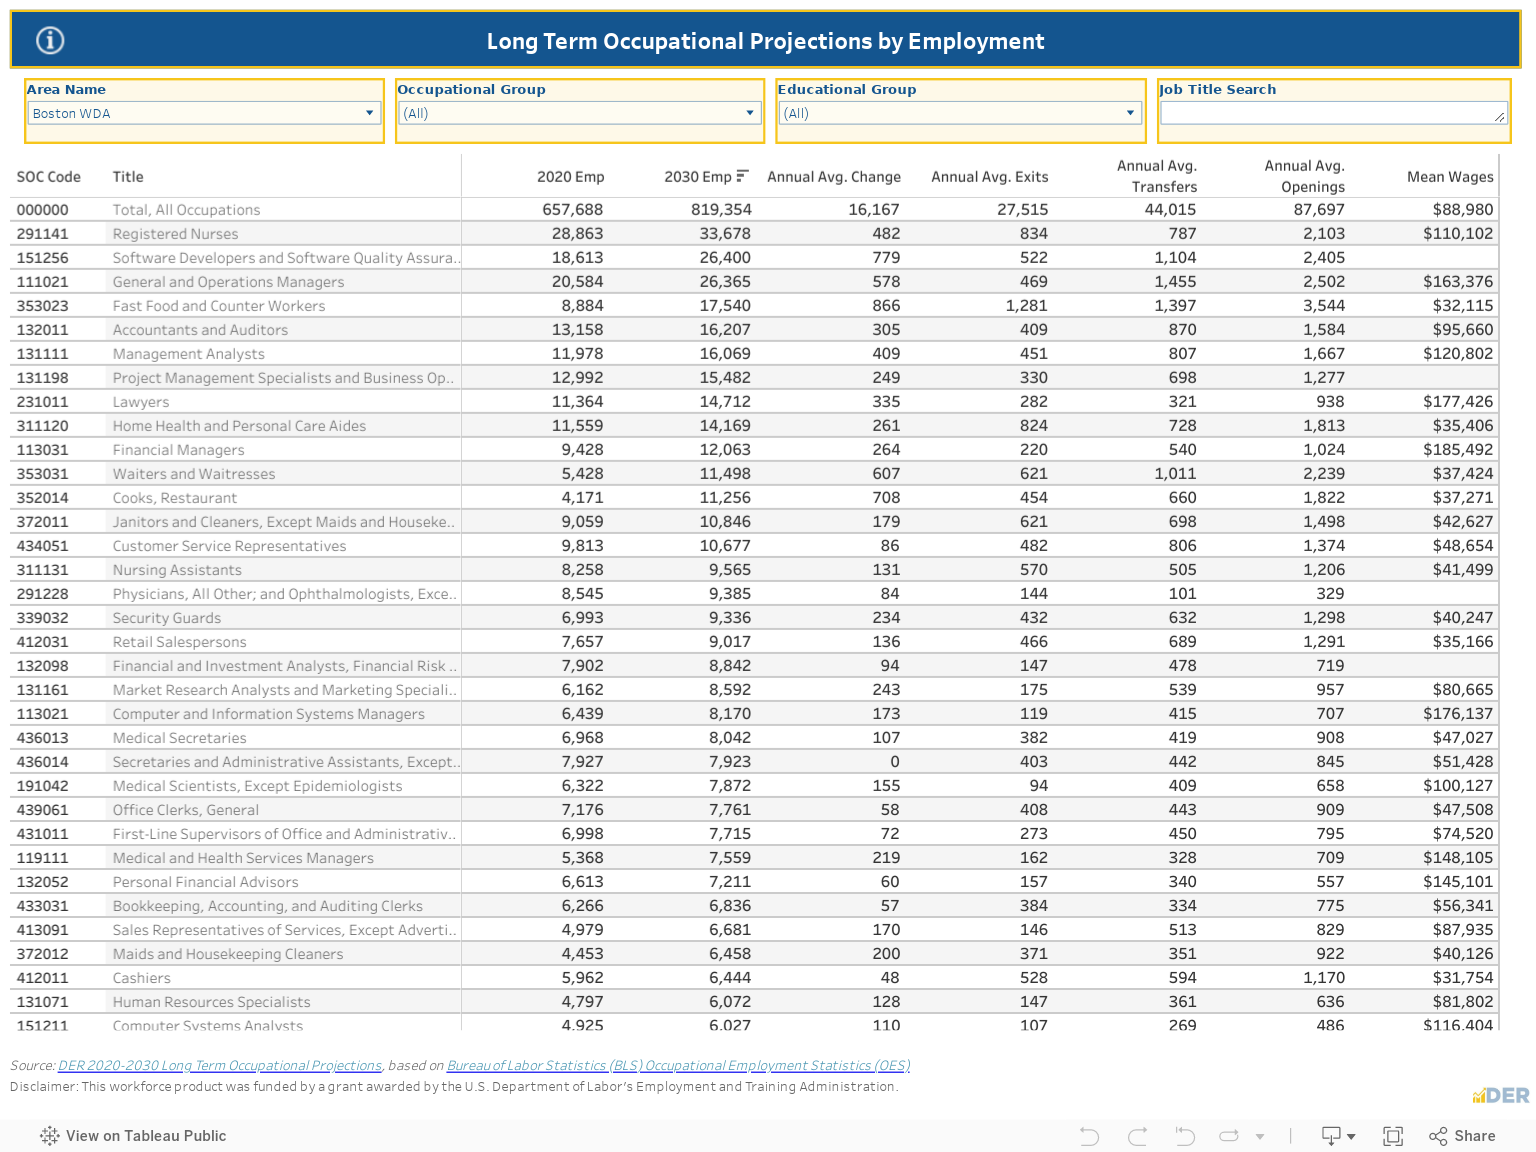
The next visualization displays the top occupations in Boston by projected 2030 employment. Other information includes projected average openings per year and mean wages. Use the drop-downs at the top of the table to select a specific occupation or filter by educational requirements.
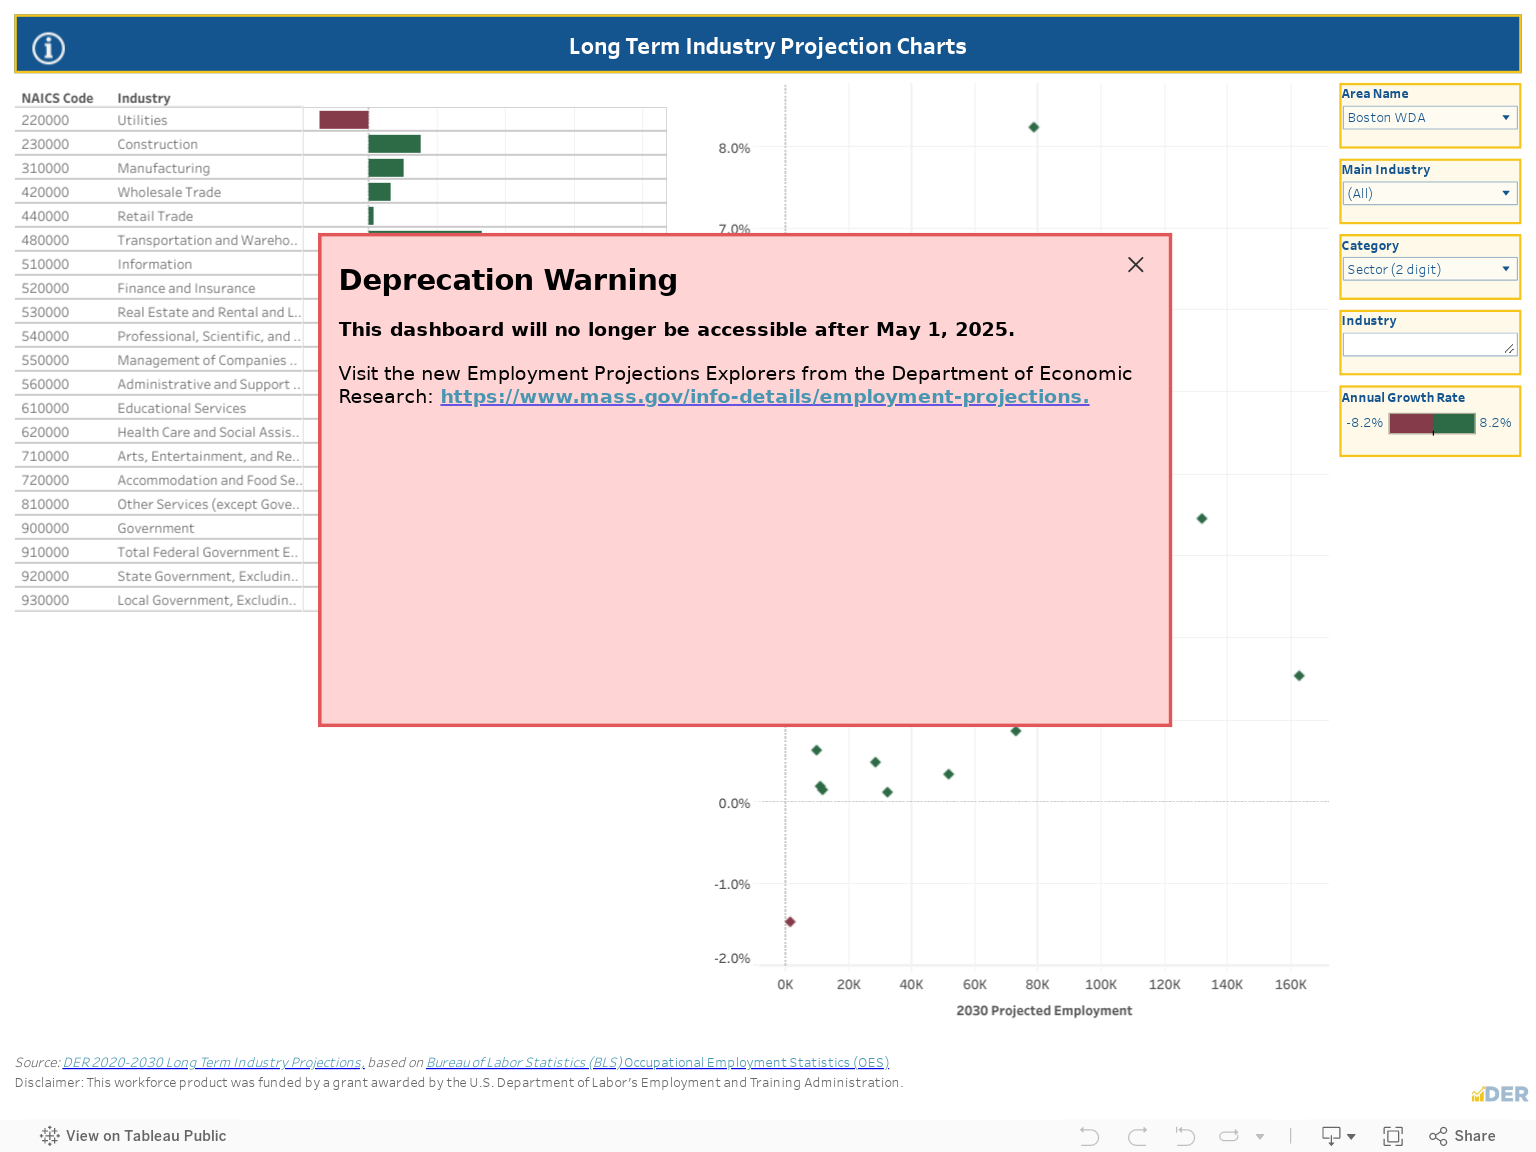
This visualization displays the expected annual growth rate and projected 2030 employment for Boston's industries, defined by 2-digit NAICS code. Use the drop-downs on the right to select to view other regions or change the level of analysis.
Unemployment Insurance Claimant Profiles (Dept. of Economic Research)
The Massachusetts Department of Economic Research provides a monthly summary of residents who have claimed unemployment insurance benefits. To download a report of Boston's claimant demographics, as well as their industry, occupation and average weekly wages prior to their UI claim, select the "Boston WDA" and a month and year in the "Choose Your Extract" section of this page.
Additional Labor Reports and Data
A labor supply analysis for the Greater Boston region which includes Boston, Metro North, and Metro South/West.
An action plan to develop, align and integrate service delivery strategies and resources for WIOA programs in a local area.
Includes state and local-level labor force and employment data curated by the Massachusetts Department of Economic Research.
Planning Department LMI Resources
Planning Department ResourcesThe MyDemographic Viewer tool is an interactive map built on U.S. Census Bureau data. With this tool, you can select a neighborhood, census tract, or the entire city to get location-specific population, education, income, housing, and employment information. Examples include:
- The number of Roxbury residents who have a bachelor’s degree
- The most common occupations for residents of Savin Hill
- The percentage of Bostonians between the ages of 25-29
The Economics Indicators dashboard provides monthly updates on the Labor Market, Mobility (transportation), Economic Activity (consumer spending), Real Estate Market, and Real Estate Development. The dashboard can help answer questions like:
- How did Boston’s unemployment rate compare to the US unemployment rate in 2023?
- What was the occupancy rate in Boston hotels in June 2021?
Use the Employment Map, an interactive map of employment in Boston by location and industry, to visualize payroll job locations across the City. Use this tool to analyze employment trends in several of Boston’s “Main Streets” and Commercial Hub locations. Clusters of dots indicate high employment density and can be filtered by a two-digit NAICS code.
Resources for Workers
Worker Resources-
Still have questions? Contact:
Workforce Development
-
43 Hawkins Street
Boston, MA 02114
